Dividend Data
Get instant stock data like dividends and financials directly in your Google Sheets or Excel.
AI tool Details
Explore More
Alternatives

About Dividend Data
Dividend Data is a powerful financial data platform designed to bring institutional-grade stock market information directly into your spreadsheets. It eliminates the need for complex APIs, coding, or manual copy-pasting by providing over 16 simple custom formulas for Google Sheets and Microsoft Excel. With access to 30+ years of historical data for more than 80,000 global tickers, users can instantly pull critical metrics like dividends, yields, payout ratios, financial statements, earnings, and price history. Built specifically for dividend and fundamental investors by a fellow investor, the tool focuses on delivering the exact data needed for deep analysis. Its standout offering includes a permanently free tier with 2,500 monthly credits, making professional investment research accessible without a high cost. The core value proposition is automation and simplicity: just type a formula and get live, updated data in your spreadsheet within seconds.
Features
Comprehensive Spreadsheet Functions
Access over 16 custom formulas designed for in-depth stock analysis directly in your cells. Functions like DIVIDENDDATA_DIVIDENDS, DIVIDENDDATA_RATIOS, and DIVIDENDDATA_QUOTE pull specific data points such as forward yield, ex-dividend dates, P/E ratios, and current price. This turns your spreadsheet into a dynamic, auto-updating research terminal without any coding required.
Extensive Historical Data Library
Gain insights with over 30 years of historical market data for 80,000+ stocks and ETFs. This deep historical context is crucial for analyzing long-term dividend growth trends, financial performance across market cycles, and conducting robust backtesting for investment strategies, all from within your familiar spreadsheet environment.
Dual Platform Compatibility
Seamlessly integrate live financial data into both Google Sheets and Microsoft Excel. The add-ins are officially available on Google Workspace Marketplace and Microsoft AppSource with high user ratings, ensuring a smooth, secure, and reliable experience regardless of your preferred spreadsheet software.
Free Tier with Generous Credits
Start analyzing immediately with a free plan that provides 2,500 credits per month without any trial expiration or credit card required. This allows users to test numerous formulas and tickers, making it an accessible entry point for individual investors before considering higher-tier plans for more extensive data needs.
Use Cases
Automated Dividend Portfolio Tracking
Build a live-tracking dividend portfolio spreadsheet. Automatically import dividend dates, amounts, and yields for all holdings. This allows investors to monitor projected income, track payment schedules, and analyze portfolio yield without manually updating each stock's data, saving hours of maintenance.
Fundamental Stock Analysis and Screening
Perform deep fundamental analysis by pulling financial statements, valuation ratios, and growth metrics for any company. Investors can create custom stock screens by building spreadsheets that compare P/E ratios, payout ratios, or EPS growth across a universe of stocks using live, updated data.
Historical Performance Backtesting
Test investment strategies using three decades of historical price and dividend data. Users can model how a dividend growth strategy would have performed, calculate total returns including reinvested dividends, and assess the volatility of specific stocks or sectors over long time horizons.
Financial Modeling and Forecasting
Enhance financial models with accurate, externally-sourced data. Incorporate real-time metrics like current share price, diluted EPS, and debt-to-equity ratios into discounted cash flow (DCF) models or other valuation spreadsheets, ensuring your assumptions are based on the latest market information.
Frequently Asked Questions
How do I get started with Dividend Data?
Getting started is simple. For Google Sheets, install the add-on from the Google Workspace Marketplace. For Microsoft Excel, install it from Microsoft AppSource. Once installed, you can immediately start using the custom formulas like =DIVIDENDDATA_DIVIDENDS("TICKER") in your spreadsheet. No API key or coding is required.
What is included in the free plan?
The free plan offers 2,500 credits per month, which do not expire. This allows you to use a significant number of data calls to test various functions and tickers. It provides full access to the suite of custom formulas within the credit limit, making it ideal for individual investors and casual users.
What kind of data can I access?
You can access a wide range of data points including dividend information (amount, yield, dates, growth), key financial ratios (P/E, P/B, payout ratio), quote data (price, volume), income statement and balance sheet items, and over 100 other fundamental metrics. The data covers 80,000+ tickers with 30+ years of history.
Does the data update automatically in my spreadsheet?
Yes, the data is live and updates automatically. When you open your spreadsheet or refresh it, the formulas will pull the most current information available from Dividend Data's servers. This ensures your analysis and portfolio tracking are always based on the latest market data.
Similar to Dividend Data

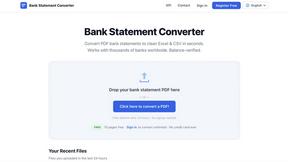
Bank Statement Engine
Free tool to convert PDF bank statements to Excel, CSV, JSON, QBO, OFX and QIF. No signup, no limits.


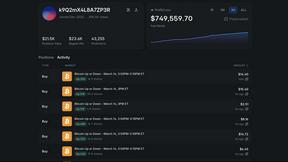
Polymarket Trading Bot For Crypto
Polymarket Trading Bot For Crypto