Dividend Data vs Redbark
Side-by-side comparison to help you choose the right AI tool.
Dividend Data
Get instant stock data like dividends and financials directly in your Google Sheets or Excel.
Last updated: March 11, 2026
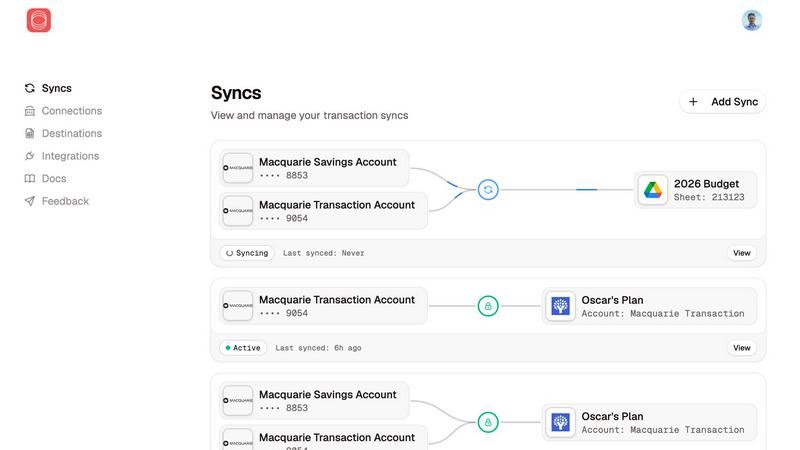
Effortlessly sync your Australian bank and brokerage data to Google Sheets and YNAB with real-time updates and no.
Last updated: March 4, 2026
Visual Comparison
Dividend Data

Redbark
Feature Comparison
Dividend Data
Comprehensive Spreadsheet Functions
Access over 16 custom formulas designed for in-depth stock analysis directly in your cells. Functions like DIVIDENDDATA_DIVIDENDS, DIVIDENDDATA_RATIOS, and DIVIDENDDATA_QUOTE pull specific data points such as forward yield, ex-dividend dates, P/E ratios, and current price. This turns your spreadsheet into a dynamic, auto-updating research terminal without any coding required.
Extensive Historical Data Library
Gain insights with over 30 years of historical market data for 80,000+ stocks and ETFs. This deep historical context is crucial for analyzing long-term dividend growth trends, financial performance across market cycles, and conducting robust backtesting for investment strategies, all from within your familiar spreadsheet environment.
Dual Platform Compatibility
Seamlessly integrate live financial data into both Google Sheets and Microsoft Excel. The add-ins are officially available on Google Workspace Marketplace and Microsoft AppSource with high user ratings, ensuring a smooth, secure, and reliable experience regardless of your preferred spreadsheet software.
Free Tier with Generous Credits
Start analyzing immediately with a free plan that provides 2,500 credits per month without any trial expiration or credit card required. This allows users to test numerous formulas and tickers, making it an accessible entry point for individual investors before considering higher-tier plans for more extensive data needs.
Redbark
Secure Data Connections
Redbark connects directly to your bank accounts using the CDR framework, ensuring secure data access and compliance. This eliminates the risks associated with outdated screen scraping methods, safeguarding your financial information.
Multi-Destination Sync
Sync your financial data to multiple destinations simultaneously, such as Google Sheets, YNAB, and Actual Budget. Each platform can have its own formatting, giving you flexibility in how you manage your finances.
Automated Background Sync
Enjoy real-time updates with background sync capabilities. Your bank sends new data via webhooks, triggering automatic updates to your connected applications, ensuring you always have the latest information.
Smart Deduplication
Redbark features intelligent deduplication to prevent duplicate entries. With overlap buffers to catch late-posting transactions, you can trust that your financial records remain accurate and clean.
Use Cases
Dividend Data
Automated Dividend Portfolio Tracking
Build a live-tracking dividend portfolio spreadsheet. Automatically import dividend dates, amounts, and yields for all holdings. This allows investors to monitor projected income, track payment schedules, and analyze portfolio yield without manually updating each stock's data, saving hours of maintenance.
Fundamental Stock Analysis and Screening
Perform deep fundamental analysis by pulling financial statements, valuation ratios, and growth metrics for any company. Investors can create custom stock screens by building spreadsheets that compare P/E ratios, payout ratios, or EPS growth across a universe of stocks using live, updated data.
Historical Performance Backtesting
Test investment strategies using three decades of historical price and dividend data. Users can model how a dividend growth strategy would have performed, calculate total returns including reinvested dividends, and assess the volatility of specific stocks or sectors over long time horizons.
Financial Modeling and Forecasting
Enhance financial models with accurate, externally-sourced data. Incorporate real-time metrics like current share price, diluted EPS, and debt-to-equity ratios into discounted cash flow (DCF) models or other valuation spreadsheets, ensuring your assumptions are based on the latest market information.
Redbark
Freelancers Tracking Invoices
Freelancers can easily sync their bank transactions to a spreadsheet or budgeting tool, automating invoicing and expense tracking. This saves time and reduces the risk of manual errors.
Investors Monitoring Portfolios
Investors can connect their trading accounts to Redbark, receiving real-time updates on portfolio performance. This integration helps in making informed decisions without the hassle of manual data entry.
Small Business Owners Managing Cash Flow
Small business owners can streamline their cash flow management by syncing transactions from multiple accounts. This allows for a clearer overview of income and expenses, aiding in better financial planning.
Individuals Seeking Financial Clarity
Anyone looking for a clearer view of their finances can benefit from Redbark. The tool provides an automated way to track spending and savings, making personal finance management straightforward and accessible.
Overview
About Dividend Data
Dividend Data is a powerful financial data platform designed to bring institutional-grade stock market information directly into your spreadsheets. It eliminates the need for complex APIs, coding, or manual copy-pasting by providing over 16 simple custom formulas for Google Sheets and Microsoft Excel. With access to 30+ years of historical data for more than 80,000 global tickers, users can instantly pull critical metrics like dividends, yields, payout ratios, financial statements, earnings, and price history. Built specifically for dividend and fundamental investors by a fellow investor, the tool focuses on delivering the exact data needed for deep analysis. Its standout offering includes a permanently free tier with 2,500 monthly credits, making professional investment research accessible without a high cost. The core value proposition is automation and simplicity: just type a formula and get live, updated data in your spreadsheet within seconds.
About Redbark
Redbark is a revolutionary financial data integration tool designed to seamlessly connect your Australian bank accounts and global investment portfolios to the productivity tools you already use, such as Google Sheets, Notion, and Airtable. It eliminates the cumbersome, error-prone tasks of manual data entry and messy CSV file imports. By utilizing Australia's Consumer Data Right (CDR) framework, Redbark provides bank-approved, secure access to vital transaction, balance, and investment holding data. This connection ensures that your information is synced automatically based on a schedule you control, flowing directly from your financial institutions to your preferred applications without being stored on Redbark servers. With a focus on simplicity and privacy, Redbark is ideal for freelancers tracking invoices, investors monitoring portfolios, small business owners managing cash flow, and anyone seeking an automated overview of their finances in familiar formats. Setup is quick and requires no coding, with support for a wide range of Australian banks via CDR, New Zealand banks through Akahu, and global brokerages via SnapTrade.
Frequently Asked Questions
Dividend Data FAQ
How do I get started with Dividend Data?
Getting started is simple. For Google Sheets, install the add-on from the Google Workspace Marketplace. For Microsoft Excel, install it from Microsoft AppSource. Once installed, you can immediately start using the custom formulas like =DIVIDENDDATA_DIVIDENDS("TICKER") in your spreadsheet. No API key or coding is required.
What is included in the free plan?
The free plan offers 2,500 credits per month, which do not expire. This allows you to use a significant number of data calls to test various functions and tickers. It provides full access to the suite of custom formulas within the credit limit, making it ideal for individual investors and casual users.
What kind of data can I access?
You can access a wide range of data points including dividend information (amount, yield, dates, growth), key financial ratios (P/E, P/B, payout ratio), quote data (price, volume), income statement and balance sheet items, and over 100 other fundamental metrics. The data covers 80,000+ tickers with 30+ years of history.
Does the data update automatically in my spreadsheet?
Yes, the data is live and updates automatically. When you open your spreadsheet or refresh it, the formulas will pull the most current information available from Dividend Data's servers. This ensures your analysis and portfolio tracking are always based on the latest market data.
Redbark FAQ
How does Redbark ensure my data privacy?
Redbark employs a pass-through architecture, meaning your data flows directly from your bank to your chosen application without being stored on our servers. We also use AES-256 encryption to protect your credentials.
What banks and brokerages does Redbark support?
Redbark supports over 100 Australian banks via CDR, New Zealand banks through Akahu, and global brokerages via SnapTrade. This extensive network allows you to consolidate your financial data seamlessly.
How quickly can I set up Redbark?
Setting up Redbark is quick and user-friendly, taking just a few minutes with no coding required. You can begin syncing your financial data almost immediately.
Can I use Redbark for personal finance tracking?
Yes, Redbark is an excellent tool for personal finance tracking. It allows you to sync your bank accounts to tools like Google Sheets or Notion, providing a clear and automated overview of your financial situation.
Alternatives
Dividend Data Alternatives
Dividend Data is a spreadsheet add-on that provides extensive historical stock market and dividend data directly into Google Sheets and Excel. It falls into the category of financial data tools designed for self-directed investors and analysts. Users often explore alternatives for various reasons, such as budget constraints, specific feature requirements, or compatibility with different platforms like proprietary software or other spreadsheet applications. Needs can vary widely from one investor to the next. When evaluating other options, key considerations include the depth and history of the financial data offered, the ease of integration with your existing workflow, the total cost of ownership, and whether the tool's specialized functions align with your specific investment strategy, such as dividend growth analysis.
Redbark Alternatives
Redbark is an innovative tool that syncs your Australian bank and brokerage data directly to productivity applications like Google Sheets and YNAB, simplifying financial management. As a secure bridge between your financial accounts and the apps you already use, it automates data transfer while ensuring privacy through Australia’s Consumer Data Right (CDR) framework. Users often seek alternatives to Redbark for various reasons, including pricing, feature sets, or compatibility with specific platforms. When considering an alternative, it's crucial to evaluate factors like data security, ease of use, integration options, and the level of support provided. A reliable alternative should offer similar functionality while meeting your specific financial management needs.