
StatPecker
StatPecker delivers quick, secure insights and stunning visuals from your company data for better decision-making.
About StatPecker
StatPecker is an innovative AI-powered data visualization tool that transforms raw data into stunning, professional infographics within seconds. Designed for users ranging from content creators to business analysts, StatPecker simplifies the complex process of data storytelling by automating visual generation. By merely asking a question or uploading a CSV file, users can access clear and engaging visuals without the need for extensive design skills or costly software. The tool is particularly valuable for professionals who require effective communication of data insights, enabling them to save significant time and costs. StatPecker is perfect for educators, marketers, researchers, and students who strive to enhance the impact of their reports, presentations, and campaigns through credible and visually appealing data narratives.
Features
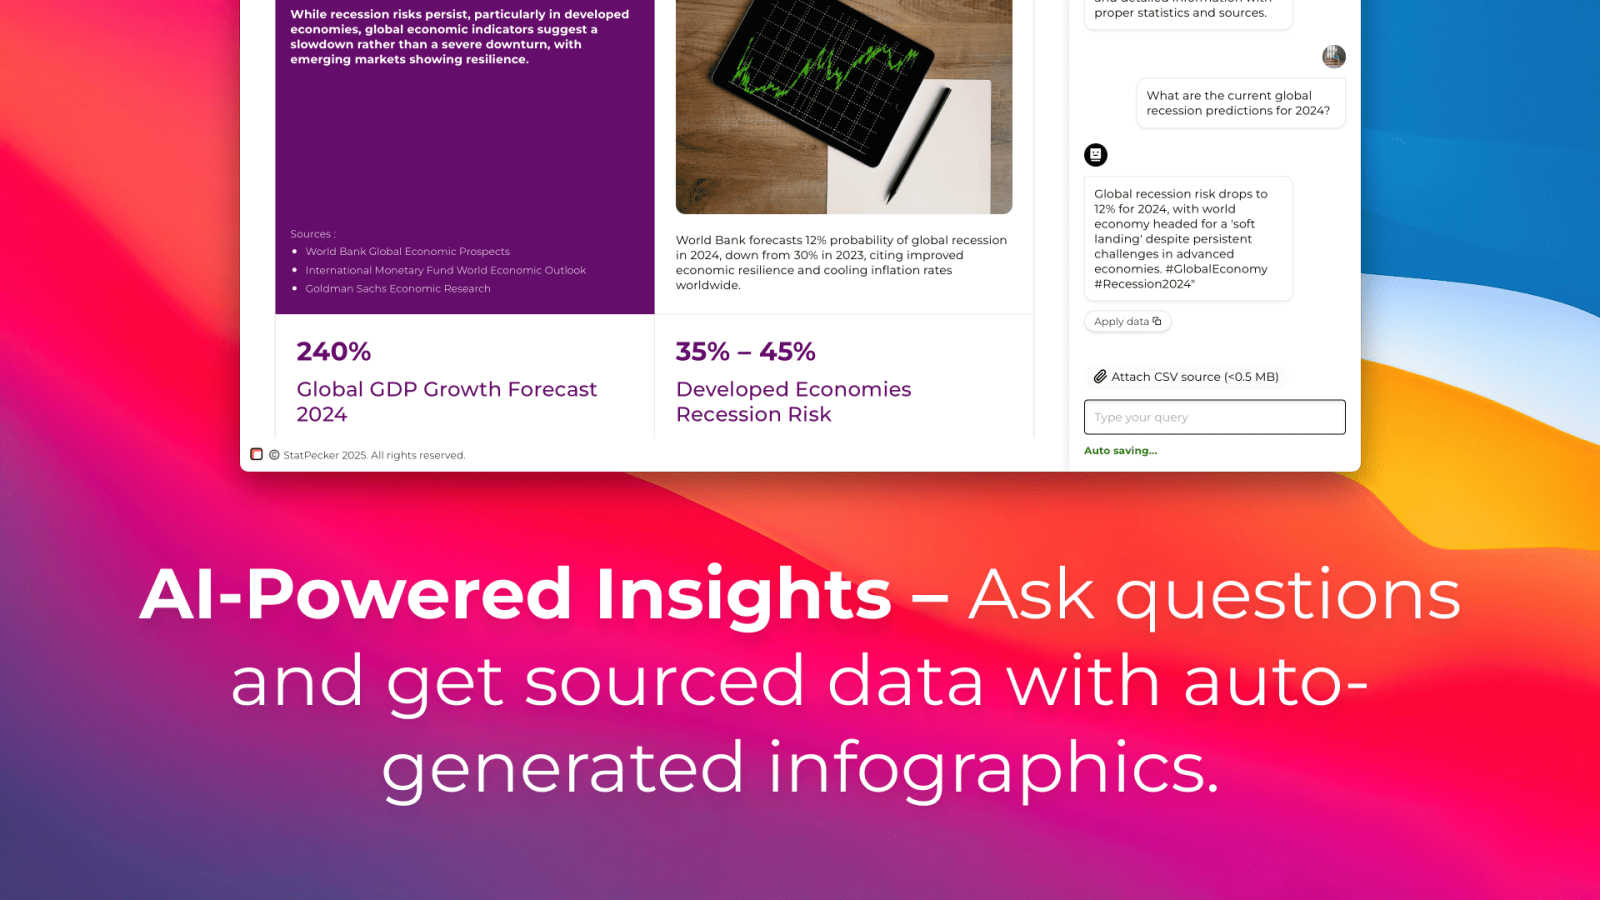
Ask Your Query
This feature allows users to obtain instant insights from validated sources simply by asking a question. There is no need for complex tools or extensive training; you can quickly get the information you need without hassle.
Publish & Embed
With StatPecker, you can make your visuals interactive and easily integrate them into various platforms such as blogs, articles, and websites. This functionality ensures that your data visualizations reach a broader audience seamlessly.
Upload & Analyze CSVs
StatPecker enables users to upload local CSV files (up to 50 MB) and extract key insights without the complexities of traditional spreadsheets. This feature allows for on-device analysis, ensuring that data privacy is maintained while gaining valuable insights.
Download & Use Anywhere
Export your infographics as images for use in reports, presentations, and other materials. This feature grants you the flexibility to utilize your visuals across multiple platforms, enhancing your data storytelling capabilities.
Use Cases
Content Creation
Content creators can leverage StatPecker to quickly generate engaging infographics that illustrate key data points, making their articles and blogs more visually appealing and informative.
Marketing Campaigns
Marketers can utilize StatPecker to analyze customer data and generate visuals that support their campaigns. This helps in presenting data-driven insights that resonate with their audience and enhance campaign effectiveness.
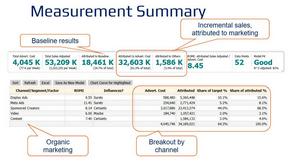
Business Analysis
Business analysts can use StatPecker to visualize trends and patterns in sales or operational data. This allows for clearer presentations to stakeholders and aids in strategic decision-making processes.
Educational Purposes
Educators and students can benefit from StatPecker by creating compelling visuals that explain complex concepts or summarize research findings, thus enhancing learning experiences and retention.
Frequently Asked Questions
How does StatPecker protect my data?
StatPecker conducts all analysis on your device, ensuring that your data remains private and secure. No sensitive information is uploaded to external servers.
Can I use StatPecker without technical skills?
Absolutely! StatPecker is designed for users of all skill levels. You can obtain insights by simply asking questions, making it accessible for everyone.
What file formats does StatPecker support?
Currently, StatPecker supports CSV file uploads, which allows users to analyze and visualize their data easily. More formats may be introduced in future updates.
Is there a free trial available for StatPecker?
Yes, StatPecker offers a free tier that includes unlimited projects, embeds, and a set number of AI queries and CSV uploads, allowing you to explore its features without any cost.
Similar to StatPecker
InContekst
Decision support framework for high consideration businesses with mix of online and offline channels, content-rich sites, and long customer journeys.
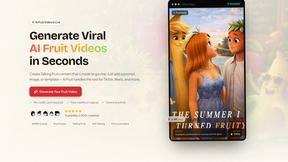
AI Fruit
Generate viral AI fruit videos in seconds — talking fruit, ASMR cuts, and surreal hybrids.
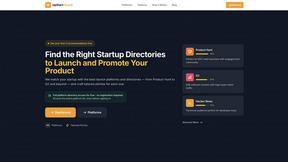
UpStart
Launch your startup on the right platforms with a verified directory and tailored recommendations.

Seedream AI Studio
Generate images with Seedream 5.0 and turn selected results into short videos in one browser workflow.

BriefIQ
BriefIQ generates complete 18-section SEO briefs in 30 seconds, writes full articles, grades content A-F and auto-improves it.

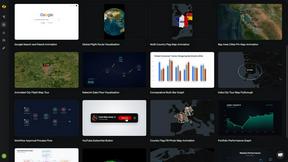
Easymotion - AI Motion Graphics Generato
AI motion graphics and map animation generator. Create videos, charts, UI explainers, and map animations with AI.