

AI tool Details
Explore More
Alternatives

About Chart Echo
Chart Echo is a historical pattern matching tool for stocks and crypto that lets you see how today's chart has played out before. Instead of relying on gut feelings or predictions, it searches approximately 450 million historical windows to find chart patterns that look like the one you are currently watching. The core value proposition is simple: the market remembers, and Chart Echo helps you access that memory in seconds.
The tool works by taking the shape of the chart you are looking at and scanning a massive database of historical price action across stocks and cryptocurrencies. It identifies the closest matches and then does the most important part: it shows you what happened next. Each historical match carries its own future, including the days and weeks that followed. Chart Echo aggregates those continuations to give you an honest, data-grounded picture of the odds. You can see how often similar setups rose, fell, or went nowhere, the average move, and the typical drawdown along the way.
Chart Echo is designed for three main user groups. Active traders can check historical analogs before taking a setup. Long-term investors can sanity-check breakouts or sell-offs against decades of precedent. Crypto watchers can match BTC, ETH, and other majors against their own past structure. The tool is not a prediction system and does not provide financial advice. It is the market's own memory, organized so you can study precedent in seconds instead of scrolling through decades of charts by hand. Chart Echo is free to start with no account required. Accounts unlock saved workspaces, and Premium adds Pro Mode, saved-setup reminders, intraday timeframes, alerts, and watermark-free exports.
Features
Historical Pattern Matching
Chart Echo takes the exact shape of the chart you are currently viewing and searches approximately 450 million historical windows across stocks and crypto to find moments that looked most like it. Each match comes with a similarity score and an explanation of why it rhymes. This is not a generic pattern library or a set of predefined setups. It is a direct comparison between your current chart and the market's entire recorded history. The system identifies structural similarities in price action, not just simple shape matching, giving you the closest possible analogs for your specific setup.
Outcome Statistics and Continuation Data
After finding historical matches, Chart Echo shows you what happened next for each one. You get aggregated outcome statistics that include how often similar setups rose, fell, or went nowhere. You can see the average move over multiple time horizons, the typical drawdown along the way, and the range of possible outcomes. This data is presented as clear numbers and visualizations, not vague predictions. It gives you an honest, data-grounded picture of the odds so you can make decisions based on precedent rather than emotion or guesswork.
Golden Overlay Visualization
Chart Echo overlays each historical match directly on your current chart in gold. This allows you to visually compare how the past pattern aligned with your current setup. You can see where the match started, how closely it tracked your pattern, and where it diverged. The overlay makes it easy to understand why a particular match is relevant and how the future played out in relation to your current chart. This visual comparison is a core part of the tool's usability, turning abstract data into an intuitive, side-by-side analysis.
Guided Five-Step Workflow
The app walks you through a single, guided path from start to finish. You pick the stock or crypto you are watching, set the timeframe and pattern length, view the ranked list of matches, overlay a match on your chart, and then act on the information. You can save the workspace, set a reminder for future fractals, or share a GIF. This structured flow eliminates guesswork and blank-canvas confusion. It is the same flow as the Chart Echo mobile app, ensuring a consistent experience whether you are on desktop or mobile.
Use Cases
Pre-Trade Setup Analysis for Active Traders
Before you take a trade setup, use Chart Echo to see the closest historical analogs and how they resolved over the following days and weeks. You can check the odds of success, the average move, and the typical drawdown for setups that looked exactly like yours. This replaces subjective pattern recognition with objective historical data. Instead of wondering if a pattern will work, you can see how it has actually performed in the past. This allows you to enter trades with a clearer understanding of the potential risks and rewards based on real market precedent.
Sanity-Checking Breakouts and Sell-Offs for Long-Term Investors
When you see a breakout or a sell-off in a stock you hold, it is easy to get caught up in the moment. Chart Echo lets you sanity-check that move against decades of precedent. Instead of relying on one analyst's opinion or a news headline, you can see how similar price actions resolved historically. This gives you a broader perspective on whether the move is likely to continue or reverse. It helps long-term investors make more disciplined decisions by filtering out short-term noise and focusing on what the market's own history suggests.
Crypto Pattern Analysis Across Assets
Crypto markets are known for repeating patterns across different cycles and assets. Chart Echo allows you to match Bitcoin, Ethereum, and other major cryptocurrencies against their own past structure and across different assets. You can see if a current Bitcoin pattern resembles a previous Ethereum pattern or a past Bitcoin cycle. This cross-asset analysis is particularly useful in crypto where historical data is shorter but patterns often rhyme across different coins and timeframes. It gives crypto traders a unique tool for identifying potential future moves.
Sharing and Collaborating on Chart Setups
Chart Echo lets you share your analysis with friends, colleagues, or your trading community. You can export GIFs and images of your chart with the golden overlays and outcome statistics. This makes it easy to discuss setups, get feedback, or simply share interesting market observations. The shareable format preserves the key information so others can see exactly what you saw. This feature turns Chart Echo from a solo analysis tool into a collaborative platform for discussing market patterns and trading ideas.
Frequently Asked Questions
How does Chart Echo find historical matches?
Chart Echo takes the shape of the chart you are currently viewing and searches approximately 450 million historical windows across stocks and crypto. It uses a proprietary matching algorithm that compares the structure of your current pattern against historical price action. The algorithm identifies moments in history where the price action looked most similar to your current setup. Each match comes with a similarity score and an explanation of why it rhymes. The system is not based on predefined patterns or indicators. It is a direct, data-driven comparison between your chart and the market's entire recorded history.
Is Chart Echo a prediction tool or financial advice?
No. Chart Echo is explicitly not a prediction tool and does not provide financial advice. It is a historical pattern matching tool that shows you how similar setups have played out in the past. The outcome statistics it provides are based on historical data and are not guarantees of future performance. The tool is designed to give you the market's own memory organized so you can study precedent. It is up to you to interpret the data and make your own trading or investment decisions. Always do your own research and consider your own risk tolerance before making any financial decisions.
What markets and timeframes does Chart Echo support?
Chart Echo supports both stocks and cryptocurrencies. You can search for any publicly traded stock or major cryptocurrency. The historical database covers approximately 450 million windows across these markets. The tool allows you to set the timeframe and the number of candles that define the pattern you want to match. Premium users get access to intraday timeframes for more granular analysis. The free version provides access to daily and higher timeframes. The mobile app offers the same guided experience for checking setups away from the desk.
Do I need to create an account to use Chart Echo?
No. Chart Echo is free to start with no account required. You can immediately search for patterns and see historical matches without signing up. Creating a free account unlocks the ability to save your workspaces and revisit them later. Premium accounts add Pro Mode, saved-setup reminders, intraday timeframes, alerts, and watermark-free exports. The core functionality of finding historical matches and seeing outcome statistics is available to all users without an account. This makes it easy to try the tool and see if it fits your workflow before committing to a paid plan.
Similar to Chart Echo
Polymarket Trading Bot For Crypto
Automate proven high-frequency arbitrage and directional trading on Polymarket's 5-15 minute crypto markets with transparent, private source code.
Trading Risk Lab
Trading Risk Lab calculates precise position sizes, stop losses, and risk metrics for every trade.
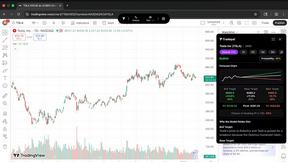
Tradepal
Tradepal delivers AI-driven stock analysis, transforming screenshots into actionable insights with real-time forecasts.
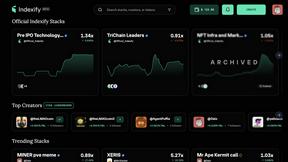
Indexify
Indexify simplifies crypto investing by allowing users to follow expert strategies and manage personalized portfolios.
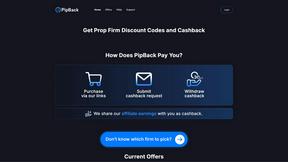
PipBack
PipBack gives prop traders exclusive discount codes and real cashback on purchases.